
Core value: One-click generate stunning data charts, clearly display business trends, boost decision efficiency and report appeal.
📖Prompt Template
🎯Customizable Parameters (3)
Data Focus:
Core data content, e.g., quarterly sales growth trends, user activity changes.
Core data content, e.g., quarterly sales growth trends, user activity changes.
Design Style:
Overall chart design style, e.g., modern minimalist, tech-inspired, business.
Overall chart design style, e.g., modern minimalist, tech-inspired, business.
Background Style:
Chart background style, e.g., gradient blue, clean white, dark tech.
Chart background style, e.g., gradient blue, clean white, dark tech.
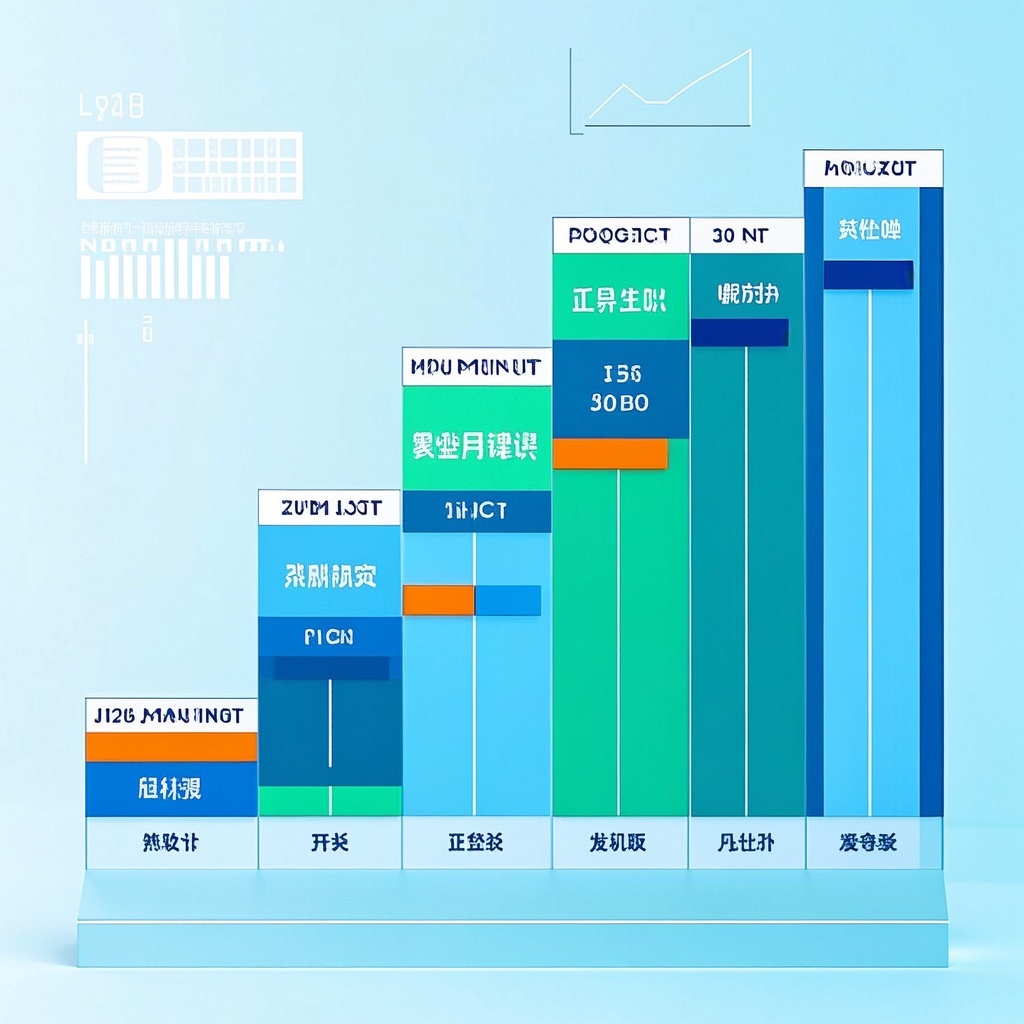
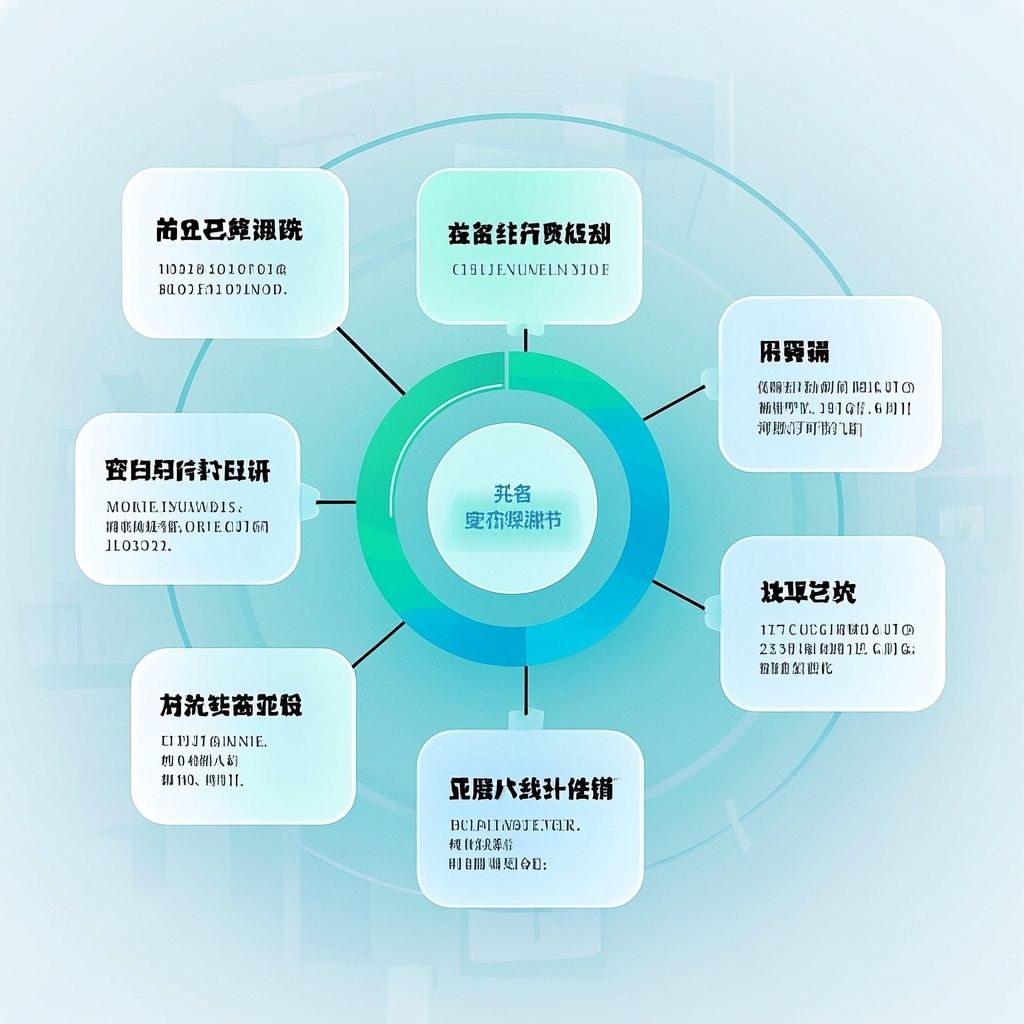
🎨Example Effect
![Image [1]-Business Data Trend Chart-VyPrompt](https://apihub-public.oss-cn-beijing.aliyuncs.com/uploads/3a1be2d5-b008-4f40-b6d6-e3f693b75531.png)
![Image [2]-Business Data Trend Chart-VyPrompt](https://apihub-public.oss-cn-beijing.aliyuncs.com/uploads/b902fc20-cc9a-4630-86fa-6e57be987e21.png)
![Image [3]-Business Data Trend Chart-VyPrompt](https://apihub-public.oss-cn-beijing.aliyuncs.com/uploads/d3225ae4-f519-4787-8d37-6259214f7b97.png)
✅Feature Summary
- One-click generate business trend charts, clearly display core metrics and changes, help management quickly grasp business direction.
- Support custom focus areas, switch by category, channel, region, etc., for more relevant insights.
- Template-based style and background, align with brand tone, ready for PPTs and reports.
- Auto-optimize color, contrast, and whitespace, highlight key data, spot critical signals instantly.
- Smartly label data points, peaks, troughs, and turning points, clarifying what happened and why it matters.
- Intelligently combine multiple chart types (line, bar, area) for clearer trend communication.
- High-res export for large screens and mobile, sharp for presentations and screenshots.
- Support one-click multiple layout versions for quick A/B comparison, finalize optimal look in minutes.
- Add narrative titles and key annotations for complete reporting logic, accelerating decision-making.
🎯Problems Solved
Use a reusable professional prompt to help managers, ops, marketing, and analytics teams quickly generate high-quality business trend charts—making complex data clear and page-ready. Customize data focus, visual style, and background to create “annual-report-grade” charts for PPTs, reports, and dashboards, boosting presentation efficiency and persuasion, unifying brand quality, cutting prep time, and accelerating decisions and resource allocation.
This content is Paid Resources. Please pay to view
¥1.8 Today Only
¥60
¥60
VIPFreeSVIPFree
Buy now
You are not logged in currently!
Paid Resources
© Copyright Notice
The copyright of the article belongs to the author. Please do not reprint without permission.
THE END


No comments yet